Jobs Table

HOMEE | 2020

Project Overview

HOMEE is a scalable home services solution connecting those with home projects and repairs to qualified providers.

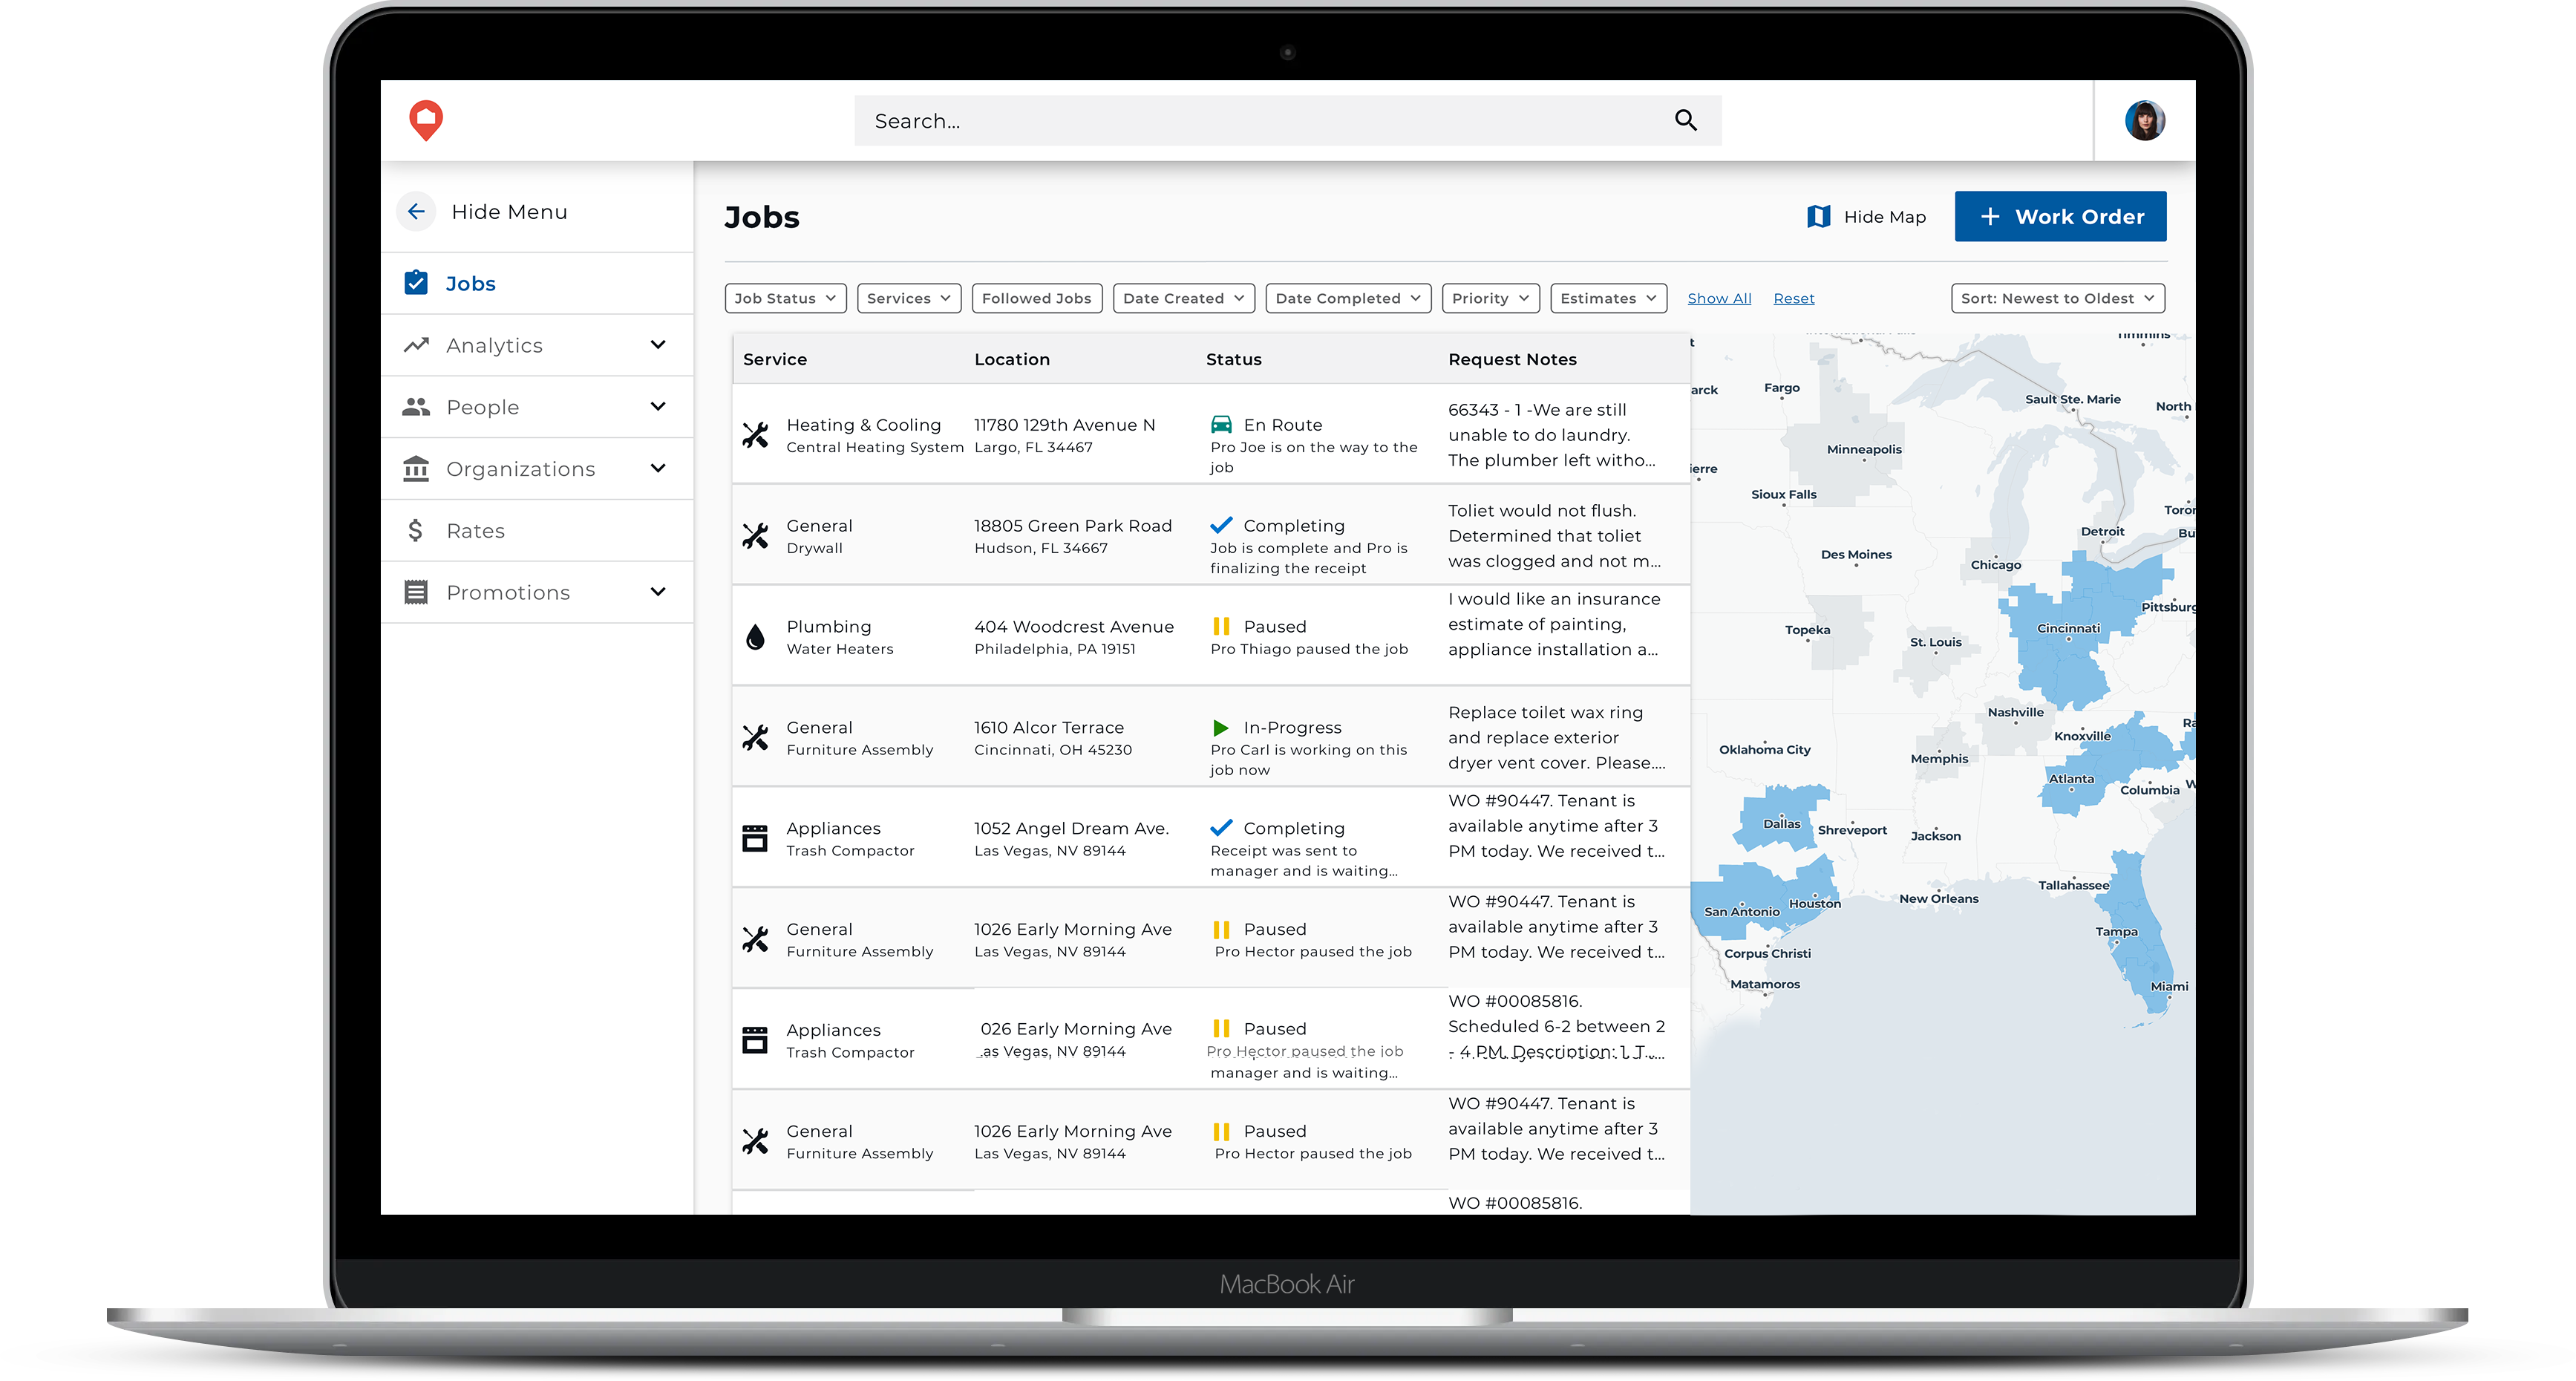
The operations team at HOMEE utilizes an internal job tracking tool called Workshop to manage jobs for customers. There was an opportunity to expand Workshop's access to property managers and others to provide transparency to their jobs. The goal was to rethink the data and design of the landing page to provide value for this broader audiences.

My Contribution

  • Research
  • User Experience
  • Visual Design
Jobs Table

Discovery

  • Interviews
  • Benchmarking
  • Survey

Interviews

Three interviews were conducted with property managers from varying parts of the industry to better understand what their day is like and what is most important to them when managing their properties' repairs.
Jamie Fraze
Manages 45 units for family member
Responsibilities:
  • Accounting
  • Coordinates emergency and scheduled repairs
  • Prepares property reports
  • Categorizes repairs on priority
Tasia Monte
Property Management executive at large real estate company.
Responsibilities:
  • Accounting
  • Close out property maintenance
  • Communicate with owners
  • Oversees properties
Nick Coso
Property Manager at large commercial real estate firm
Responsibilities:
  • Tentant ledgers
  • Setting up seasonal contract work
  • Budgeting
  • Managing repair jobs

Themes

Theme 1 | Efficiency & Hold Ups

It is very important to understand why there is a hold up at the job site. Are they waiting on the resident, the pro, me, or something else?

Theme 2 | Communication

I touch base at each job at least once a day. I wanted to know how the job is progressing. What are the hold ups and if there were any unexpected issues.

Theme 3 | Manual Entry

We color code excel docs every week based off where the jobs are at in the process to keep track...
I print out a tracking sheet and put the dates I send the estimate and when I get them back.

Benchmarking

In parallel with interviews, existing property management dashboards were compared against one another to see what details on job repairs were available for property managers. These products ranged from large multifaceted products to smaller software solutions. The table below highlights the types of information  available for each product.
Table highlights what information was displayed in each of the property management dashboards.

Survey

After interview and benchmark insights were gathered, all potentially valuable data points were compiled and ranked by property managers and our operations team from most to least important. From the survey, unique job data was important to help property manager's identify one job from another (i.e. work description). Especially when some of the data could be repeating from one job to the next (i.e. service type).

1 = Most Important
13 = Least important

Ideation

  • Wireframing
  • Visuals

Wireframing

From the research, I discovered that property managers had no consistent way of prioritizing or organizing their jobs systematically. Therefore the dashboard on Workshop needed to allow for some flexibility to sort through the numerous jobs a property manager could have going on at one time. I looked into multiple ways to group these jobs and ways to display job data while maintaining some flexibility.

Visuals

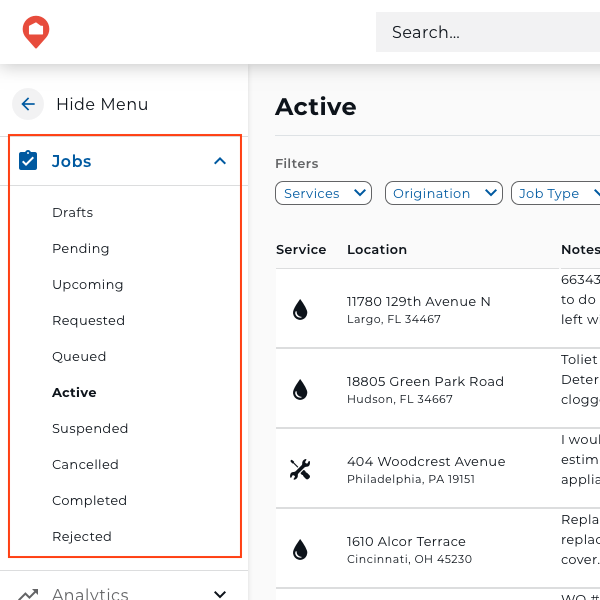
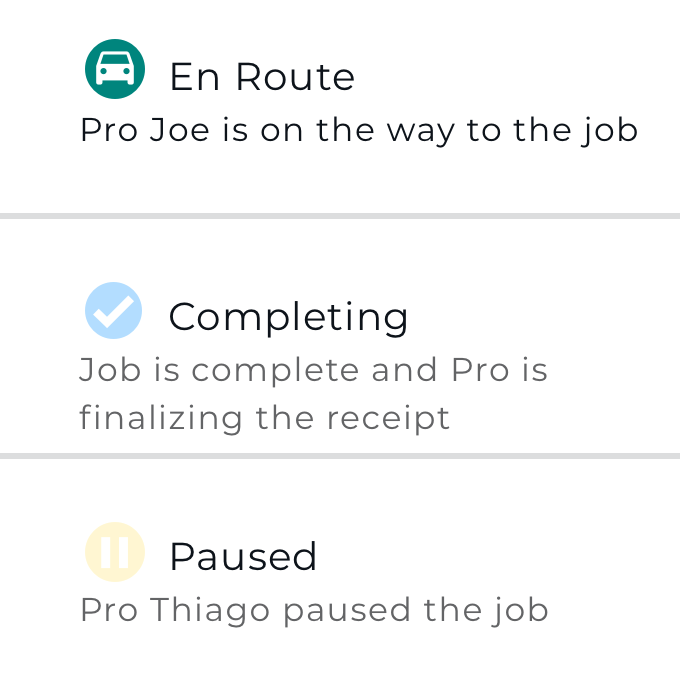
Once the data and job structure was decided, exercises were done to explore how to enhance the table visuals to make it more skimmable.

Feedback

  • Usability Testing

Usability Testing

Five testers took part in a usability test with a high fidelity prototype. The session was conducted to see if users were able to identify a unique job from a long list, filtering the jobs by certain criteria, and sorting and switching data content.
The designs for the interface for the table dropdown were reevaluated. The intent of the original design was to expose more data points by grouping similar data in a dropdown that could be selected. This was proven to be unintuitive. Designs were simplified only displaying the single most important data point. In the future if additional data points were proven necessary, an admin tool to customize the table would be explored.

Final Designs

  • Desktop
  • Mobile

Mobile